
Learn how to build a setup that will help you predict a battery's performance as it ages using a Trinket M0 and software algorithms.
Another piece of information about the battery condition that can be very helpful is age; a prediction of how much longer the battery can be used before it must be replaced. It is possible to quickly incorporate battery-age into a hardware design with purpose-built chips such as the Maxim MAX17055. AAC Director of Engineering Robert Keim provides an overview of this approach in his 2017 overview of this Maxim power management IC designed for portable devices.
This article explores some straightforward software algorithms we can use to make a similar prediction. If your system design already includes a microprocessor with some spare ADC ports, this approach can avoid the cost of an additional part. We will look at the algorithms in general, then look at some real results with lithium batteries.
What Is Battery Capacity?
A useful battery has predictable behavior; it can supply a constant amount of power, for a predictable amount of time, within a narrow voltage range. The ‘capacity’ or ‘C rating’ for batteries is probably the most useful parameter to express this.
Capacity describes how much total energy can be delivered by the fully charged battery, in a nominal usage pattern. For small batteries such as those found in portable electronics, it is usually expressed in units of milliamp-hours (mAh). Much of this article will analyze a lithium battery with a C rating of 1300mAh.
Notice, though, that milliamp-hours are not units of energy. Energy is the product of voltage, current, and time; milliamp-hours represent only current and time. It is inferred that the measurement is relative to a constant voltage; the nominal voltage of the battery. A nominal usage pattern will allow the battery to deliver its full C rating.
A very important part of this pattern is the discharge rate (in amps). Different battery chemistries have different limits on this. A simple and reasonable assumption to begin with is that you will get the rated amount of energy from a lithium battery if you discharge it at about 1⁄2 of the C rating, or less. So, for example, with our lithium battery rated at 1300mAh, we can only expect to draw this much energy from the battery if we keep the current flow below 650 milliamps on average. If this guideline is followed, it will take two hours or more to fully discharge the battery.
As another example of discharge-rate limits, consider NiMH AA cells. Many manufacturers specify that the nominal discharge rate for NiMH cells is 1/5 of the C rating.
There are high-performance batteries that can exceed these typical limits; check the manufacturer’s specifications whenever possible.
Estimating Battery Age and Capacity
It is common to describe battery age in terms of present capacity versus original (new) capacity, and that is what we will do here. We will continuously monitor the voltage and current at the high side of our battery while it is in use and discharging. This is the raw data on which we will apply our software algorithm.
First, we will estimate the present capacity of the battery. We can do this within the timeframe of one reasonably long discharge event. It doesn’t need to be a complete discharge event (more on this later).
Finally, the present capacity estimate can simply be compared to the manufacturer’s specified ‘new’ capacity, giving the user a percentage-degradation.
Designing a Test Harness
Below is the schematic for the circuit we'll be working with:

BT1 is our lithium battery pack. We are going to use a small Atmel microprocessor, the ATSAMD21, as our monitoring and analysis system. It has the analog-to-digital ports we need, and is nicely packaged by Adafruit with CircuitPython ready to run, in the Trinket M0 development board. With one of the board’s ADC ports connected directly to the battery high-side, we will have the battery voltage monitoring we need.
Our device load is represented by a precision power resistor (R1). This means that our instantaneous battery current can be calculated from our battery voltage; we don’t need to sense it separately. If you decide to assemble this circuit, pay close attention to the power dissipation in this part. In the most power-intensive example we give, the dissipation in this part will be 3 watts. So we use a part that is rated for a maximum of 5 watts. It still gets very hot.
In a real product design, monitoring the load current is more complex. It could be accomplished with a Hall-effect sensor, or a precision shunt resistor in series with the battery. Both of these approaches would provide a voltage signal representing the current flowing out of the battery. That signal would be sensed by one of the other ADC ports on the microcontroller.
The remaining aspects of the circuit are:
- A bypass capacitor (C1) for power stability
- A buzzer (BZ1) that will alert us when the battery discharge cycle is complete
- A resistor divider (R2/R3) to accommodate the limited ADC input range of the microprocessor
Here is what the system looks like on the lab workbench:

The load resistance in this case is 20 ohms; realized by two 10 ohm resistors in series. These resistors are rated for 1 watt of power dissipation.
You can also see that the microprocessor breakout board has a USB connection. This connection has two important functions. We use it:
- To transfer scripts to the processor for execution
- To access a serial port, where the processor will send output.
A full description of these mechanisms is available at Adafruit.
Here are a couple quick examples in a Linux shell to demonstrate the interactions:
cp monitor.py /media/aaron/CIRCUITPY/main.py
This shell command copies a script to the Trinket processor for execution. The processor shows up in the Linux system as a removable file system named CIRCUITPY. The script must be transferred to the top-level directory, and renamed main.py in order to execute.
./log |tee voltage_over_time.dat
This command initiates a script named log to run on the Linux system. It will connect to the serial port provided by the Trinket. Output generated by scripts running on the Trinket will be printed to the Linux console. By adding a pipe and the tee command, we duplicate the output and save it to a file. You can see the log script here.
Characterizing the Battery
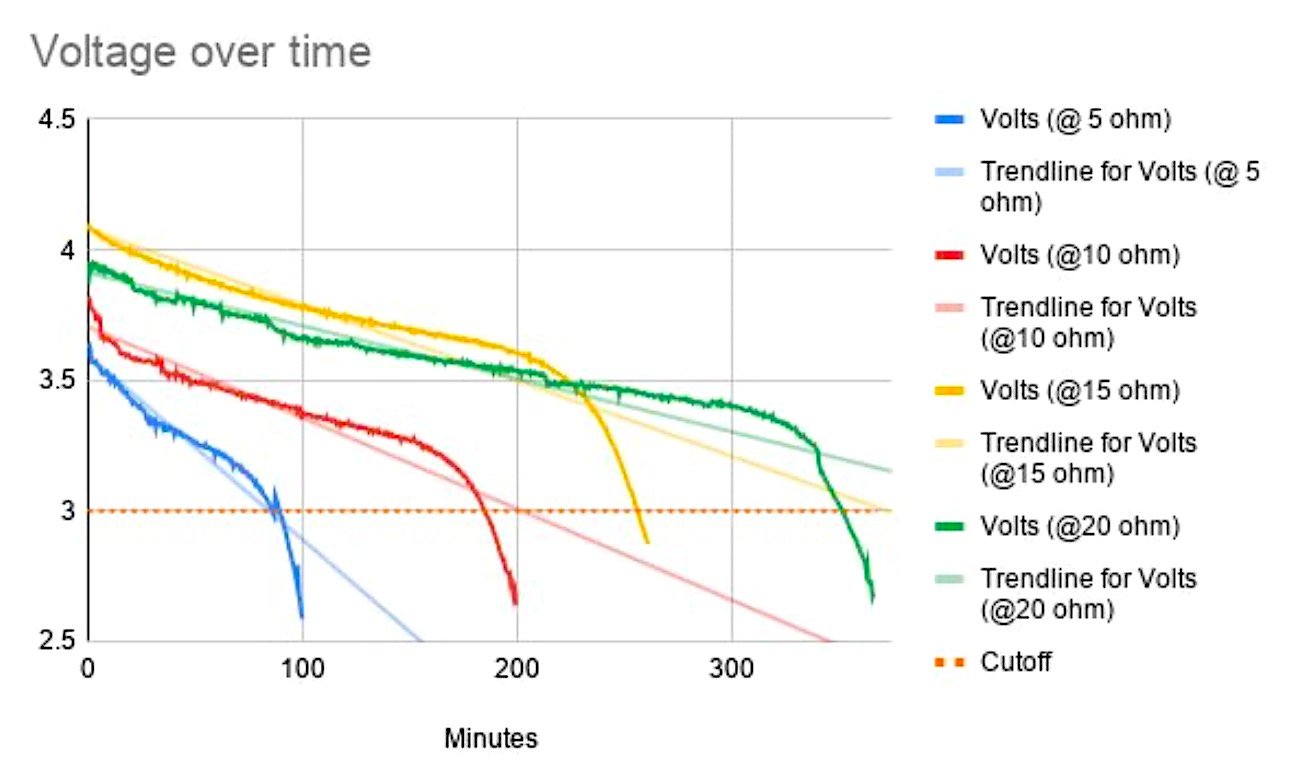
The first thing we will do is look at the discharge pattern of the battery over the operational range. We fully discharge the battery with four different loads. We monitor the battery voltage at 5- or 10-second intervals, with this script running on the Trinket.
Here is what we see:
Calculating Present Capacity
The capacity of the battery is closely related to the area under the voltage lines above, from time=0, to the time when the battery voltage drops below a useful, or ‘cutoff’ level. If you want to compare your capacity estimates to the rated capacity provided by the manufacturer, you need to use the same cutoff. For a lithium battery pack with a nominal voltage of 3.7, a typical specified cutoff would be 3 volts.
Our approach for determining present capacity could be to simply wait for a full discharge cycle to occur, and integrate all the current measurements in this range. But that would not be very helpful; the typical usage pattern might never include a full discharge.
Instead, we will monitor the current and voltage from the beginning of a discharge cycle (t=0), until some arbitrary time Tj. We can calculate the used capacity up to that time from the measured data.
We can observe in our characterization data that while the power being delivered by the battery is constant, the battery voltage is dropping at a constant rate. So the ratio of used capacity to total capacity can be approximated as equal to the ratio of the voltage changes over the same intervals:
Cmeasured / Cpredicted = (V0 - Vj) / (V0 - Vcutoff)
This can be solved for Cpredicted, the only unknown.
Graphically, the strategy looks a bit like this:

Comparing this to the measured data, we can see that for discharge cycles with low current, the real data and the model diverge. In the real data, rate of change in voltage becomes nonlinear near the end of the cycle. Our single-line model would result in overestimating the capacity. We can reduce this error by choosing a different cutoff voltage, as a function of the average
current during our measurement interval. We’ll pick four points from our measured data and fit them to a line, as a function of current:
| Nominal current (mA) | Adjusted cutoff for linear approximation (V) |
| 740 | 3 |
| 370 | 3.1 |
| 247 | 3.3 |
| 185 | 3.2 |
And here is a least-squares linear approximation for these points: Vcutoff = -0.449 * Inominal + 3.23
Here is the Python script used to find these line parameters, and the associated graph:

With these additional parameters in hand, we are finally ready to code a process that will estimate present capacity, from a partial discharge. The demonstration process script is here. Using it to monitor the same battery we tested above, this is what it reports after discharging the battery for one hour:
minutes 61.00, voltage = 3.849
end monitoring; new charging cycle begun.
capacity estimate after 61.00 minutes:
average current = 263.11 mA
capacity used = 267.50 mAh
voltage monitor start = 4.06 volts
voltage monitor end = 3.85
volts adjusted voltage cutoff = 3.20 volts
predicted total capacity = 1076.08 mAh
This prediction compares well with the data we gathered when we characterized the battery: If we integrate the current measurements for the full discharge with the 15 ohm load, we get a purely measured capacity of 1073 mAh.
So finally we can estimate the battery age! Compared to the rated capacity of 1300mAh, we would conclude that this battery is at about 82% of its original capacity.
0 comments:
Post a Comment